Summer Special Limited Time 65% Discount Offer - Ends in 0d 00h 00m 00s - Coupon code: dcdisc65

Page: 1 / 2
Total 15 questions
Exam Code: QSBA2021                Update: Oct 16, 2025
Exam Name: Qlik Sense Business Analyst Certification Exam - February 2021 Release

Qlik Qlik Sense Business Analyst Certification Exam - February 2021 Release QSBA2021 Exam Dumps: Updated Questions & Answers (October 2025)

Question # 1

A business analyst is creating an app for the sales department

Users of the app most be able to create sheets and analyze data The salesdepartment has several additionalrequirements

• Reuse the global sales visualization

• Create new visualizations

• The app has over 100 visualizations

Users will NOT have access to the full data model

What should be added to the master items to meet the requirement?

A.

• All fields as dimensions and measures

• All visualizations

B.

• All fields as dimensions and measures

• Selected visualizations

C.

• Seated fields as dimensions and measures

• Selected visualizations

D.

• Selected fields as dimensions and measures

• All visualizations

Question # 2

A business analyst wants to send an email to app users when the region's sales exceed $50,000. The notification must be delivered through a mobile app What should the business analyst configure?

A.

An email trigger on a data reload

B.

An action on the sheet containing the KPI

C.

A destination using Qlik NPrinting

D.

A condition using Qlik Alerting

Question # 3

A business analyst is developing an app that contains a data model with fields Country. City. Sales ProductName and ProductCategory.The global sales manager wants to add new visualizations to this app

The business analyst must include the following

• Ability to dynamically change the number of countries and cities

• Display a maximum of 10 countries

• Display a maximum of 5 cities per country

Which steps should the business analyst take?

A.

1 Create two variables vCountry and vCity

2 Add a slider for vCountry and vCity

3 Apply the vanable to each virtualization

B.

1 Add an input field for vCountry and vCity

2 Sat the dimension limitation to the required maximum values 5 and 10

3 Apply the variable to each visualization

4 Add a bookmark Country and City

C.

1Add an input field for vCountry and vCity

2 Set the dimension limitation to the required maximum values 5 and 10

3 Apply the variable to each visualization

D.

1 Create two variables vCountry and vCrty

2 Add a slider for vCountry and vCity

3 Apply the variable to each virtualization

4 Set a sheet action that limits the data displayed

Question # 4

A business analyst ;s creating an app tor the team. A set of selections must be applied every time an app is opened.

What should the business analyst do to meet this requirement?

A.

Use a sheet action and apply a bookmark named 'Default'

B.

Create a masnup and use the API to apply default selections

C.

Create a bookmark and select 'Set selections as app default"

D.

Use Section access to predefine tie default selections

Question # 5

A business analyst creates an app for a large retailer The app is based on me past ^2 months of transactional data in CSV formal

After successfully demonstrating the app the retailer provides a tile that contains another seven years of data

After the new datais loaded the previously responsive app takes 10 times longer to respond to users' selections The app has many complex expressions

Which two actions should the business analyst take to resolve the issues?(Select two)

A.

Request the data architect to create flagsin the data model to optimize set analysis expressions

B.

Use JOIN statements to reduce the number of tables m the data model

C.

Make sure a I master items contain variables that define the expressions

D.

Replace set analysis with calculated fields in the data manager

E.

Create versions of the app using a WHERE clause m the data manager to restrict the data

Question # 6

A business analyst has access to all ofa company's data tor the past 10 years The source table consists of the following fields Transactions Transaction Time Transaction Date Transaction Year Cardholder Cardholder address Cardissuer and Amount Users request to create an app based on this source

Users only review me data for the past 2 years Data must be updated daily Users do not view cardholder into

What should the business analyst do to reprove the app performance?

A.

1. Deselect Cardholder and time fieldin data manager

2. Use apant based on auto-calendar fields

3. Perform a daily reload via the data manager

B.

1. Delete Cardholder and time fields in data manager

2. Use set analysis to show data based on transaction year

3. Use an API to perform a daily reload task

C.

1. Deselect Cardholder and time fields in data manager

2. Apply a filter to extract data based on transaction year

3. Request a daily reload task from the System Admin

D.

1. Delete Cardholder and time fields in data manager

2. Use a bookmark based on auto-calendar fields

3. Use the reload function in the sheet Editor asset panel

Question # 7

A business analyst s creating an app for the sales team. The app must meet several requirements

• Compare 10 top -performing sales representatives and the amount of sales for each

• Investigate margin percentage and total sales by each product category

• View distribution of sales amount

Which visualizations should be used for this app?

A.

A treemap box plot, and histogram

B.

A bar chart, line chart, and scatter plot

C.

A treemap container and distribution plot

D.

A bar chart scatter plot and histogram

Question # 8

Refer to the exhibit.

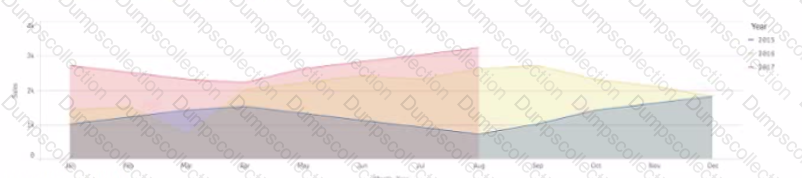
A CEO wants to use a similar visualization on the company's dashboards

The visualization must meet several requirements

• Show three years of sales data

• Display sales trends by month

• Allow comparison of years using an area style display

Which set of actions should a business analyst take to meet these requirements?

A.

• Add an area chart

• Add Month first then Year as the dimensions

• Add SumfSates) as the measure

• In the properties panel under Area select the dimension Year

B.

• Add a fine chart

• Add Month first then Year as the dimensions

• Add Surry Sales > as the measure

• In the properties panel under Presentation select Area

C.

• Add a ,line chart

• Add a master drill-down dimension with Year and Month

• Add Sum(Sates) as the measure

• In the properties panel under Presentation, select Area

D.

• Add an area chart

• Add Year first then Month as the dimensions

• Add Sum(Sales) as the measure

• In the properties panel under Area select the dimensions

Question # 9

A business analyst s developing an app 10 track the influence of the company's mascot cat on instagram The marketing department has several requirements for this solution.

• Information must be updated every hour to the company's information monitor

• Data from Instagram must be fetched over a REST connection and combined with Google Analytics data

• There must be a way to visualize changes of followers *i a map

Which two features are needed to meet these requirements? (Select two.)

A.

Standard map visualization

B.

Mashups

C.

Qlik Sense Mobile offline

D.

Qlik NPrinting

E.

Qlik web connectors

Question # 10

A large auditing firm has a proprietary web portal that all of the' customers use to access their own data. The owner of the portal has asked if it is possible to embed some Ok visualizations within the portal when will present the data back to the Individual customers.

The data within the visualizations must be live and provide up-to-date data every time the customer logs in to the portal and updates when the QlikSeriesapp is reloaded.

What should the business analyst recommend?

A.

Qlik Dynamic \news

B.

ODAG

C.

Embedded Stories

D.

QlikAPIs

Page: 1 / 2
Total 15 questions

Most Popular Certification Exams

Payment


Contact us

dumpscollection live chat

Site Secure

mcafee secure

TESTED 16 Oct 2025