A business analyst is building an app to analyze virus outbreaks. They create a bar chart using a dimension of Continent, and a measure of Sum (Knowning sections). They require a secondary bar on the chart, so they create a second measure using Count (MajorCities).
The bar chart adjusts, but no bars are visible for this second measure. Which action should the business analyst take to resolve this issue?
A customer is developing over 100 apps, each with several sheets that contain multiple visualizations and text objects. The customer wants to standardize all colors used every object across every app. The customer also needs to be able to change these colors quickly, as required.
Which steps should the business analyst take to make sure the color palette is easily maintained in every app?
An app needs to load a few hundred rows of data from a .csv text file. The file is the result of a concatenated data dump by multiple divisions across several countries. These divisions use different internal systems and processes, which causes country names to appear differently. For example, the United States of America appears in several places as 'USA', 'U.S.A.', or 'US'.
For the country dimension to work properly in the app, the naming of countries must be standardized in the data model.
Which action should the business analyst complete to address this issue?
A clothing manufacturer has operations throughout Europe and needs to manage access to the data.
There is data for the following countries under the field SACOUNTRY -> France, Spain, United Kingdom and Germany. The application has been designed with Section Access to manage the data displayed.
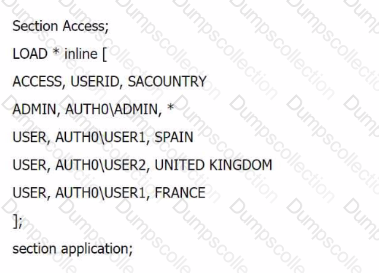
What is the expected outcome of this Section Access table?
The human resources department needs to see a distribution of salaries broken down by department with standard deviation indicators.
Which visualization should the developer use?
Refer to the exhibit.
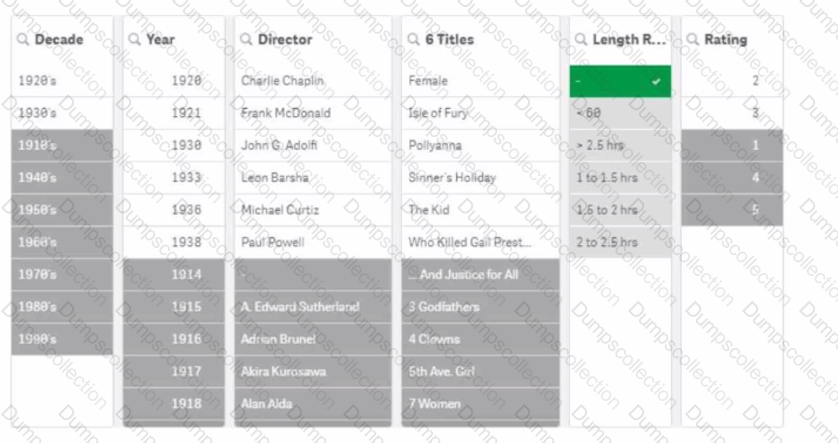
A movie analyst is using an app to gain insights into films created in the early 20th century. The analyst reviews the filter for Length Range, notices a hyphen "-", and selects it.
What can the analyst determine from the resulting filter panes?
A business analyst needs to create a visualization that compares two measures over time using a continuous scale that includes a range. The measures will be Profit and Revenue.
Which visualization should the business analyst use?
A business analyst has access to all of a company's data for the past 10 years. The source table consists of the following fields: TransactionID, TransactionTime, Transaction Date, Transaction Year, Cardholder, Cardholder address, Cardissuer, and Amount.
Users request to create an app based on this source with the following requirements:
•Users only review the data for the past 2 years
•Data must be updated daily
•Users should not view cardholder info
Which steps should the business analyst complete to improve the app performance?
A business analyst needs to create two side-by-side charts for a sales department with the following data:
• Number of orders
• Name of the customer
• Percentage of margin
• Total sales
The charts use a common dimension, but each chart has different measures. The analyst needs to create a color association between the two charts on the dimension values.
Which action should the business analyst take?
Exhibit.
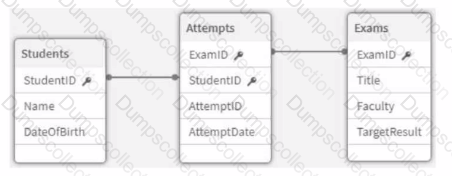
Refer to the exhibit.
An app is being developed at a university to monitor student exam attempts- Three core tables are loaded into the app for Students, Exams, and Attempts. Students can attempt the same exam multiple times.
Before building any visualizations, the business analyst needs to know:
• How many students are in the system
• What percentage of students have not yet attempted an exam
Which metadata should the analyst focus on to answer these questions?

TESTED 20 Jul 2026