A company CEO requests an app that contains global sales information. The CEO needs to present this information to an audience of international investors during an upcoming meeting.
The presentation must meet several requirements:
• Contain visualizations that present clearly to a large audience
• Answer audience questions dynamically
• Be made available as shared content
• Emphasize important sales revenue
Which Qlik Sense features should the business analyst prepare?
A company CFO has requested an app that contains visualizations applicable to analyzing the finance data. Each regional finance team will analyze their data and should only have access to the data in their region. The app must contain a high-level sheet that navigates to relevant detail sheets.
Which features support a logical design structure?
A business analyst is creating a new app with sales data. The visualizations must meet several requirements:
A Bar chart that shows sales by product group is used in multiple sheets
• A KPI object that visualizes that the total amount of sales is used once
• A Treemap that shows margin by product group is used one time inside a Container
Which visualization should be added to the master items library?
A dashboard developer finishes creating a supply chain analysis app and is presenting it to leadership for review. The landing page shows four visualizations including:
• Bar chart showing available supply by product category
• Line chart showing total cost of deliveries to the warehouse by month-year
• Scatter plot showing cost of delivery and time-to-deliver by product
• A map that shows the volume of delivery from suppliers to warehouses using a line layer
Leadership asks the developer how they can see the total cost of delivery overall. How can the analyst show this information to leadership?
A company has sales data where every Customer ID can be assigned to one or more Sales Account ID. Sales Accounts are assigned to one of eight Groups. The business analyst is creating an app with the following requirements:
• Each Group should have a separate sheet
• The Sales Account can only see its own customers
• The Sales Account can navigate only to the sheet for the Group assigned
The business analyst has created a Section Access table, in which each Sales Account ID is assigned their CustomerlDs. Which action should the business analyst take next?
A company director who spends very little time in applications needs to be informed when a threshold is breached. Which feature should the business analyst use?
A business analyst is building an app to analyze virus outbreaks. They create a bar chart using a dimension of Continent, and a measure of Sum (Knowningsections). They require a secondary bar on the chart, so they create a second measure using Count (MajorCities).
The bar chart adjusts, but no bars are visible for this second measure. Which action should the business analyst take to resolve this issue?
A clothing manufacturer has operations throughout Europe and needs to manage access to the data.
There is data for the following countries under the field SACOUNTRY -> France, Spain, United Kingdom and Germany. The application has been designed with Section Access to manage the data displayed.
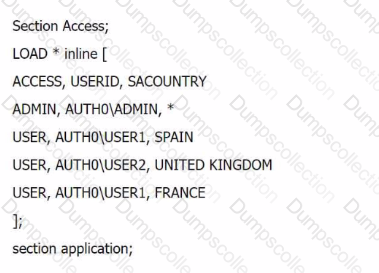
What is the expected outcome of this Section Access table?
The business analyst creates one table by concatenating and joining several source tables. This has resulted in a table of several thousand rows that may have several columns containing between 30% and 70% null values. The business analyst needs to understand the level of null values in each field of this table to determine if this is an issue.
Which capability should the business analyst use?
Refer to the exhibit.
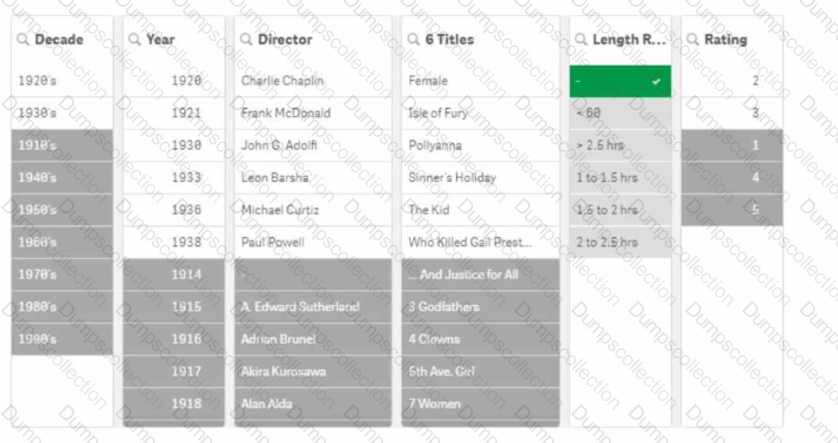
A movie analyst is using an app to gain insights into films created in the early 20th century. The analyst reviews the filter for Length Range, notices a hyphen "-", and selects it.
What can the analyst determine from the resulting filter panes?

TESTED 19 Jul 2026