Summer Special Limited Time 65% Discount Offer - Ends in 0d 00h 00m 00s - Coupon code: dcdisc65

Page: 1 / 2
Total 15 questions
Exam Code: QV12BA                Update: Oct 16, 2025
Exam Name: QlikView 12 Business Analyst Certification Exam

Qlik QlikView 12 Business Analyst Certification Exam QV12BA Exam Dumps: Updated Questions & Answers (October 2025)

Question # 1

A business analyst needs to create a dashboard showing only numerical values. There is NO need to filter data or select any

dimensions.

Which three objects can the business analyst use? (Select three )

A.

Bar chart

B.

Grid chart

C.

Gauge chart

D.

Scatter chart

E.

Straight table

Question # 2

Refer to the exhibit.

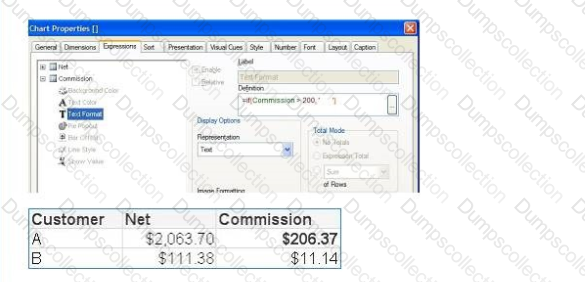
A business analyst creates a straight table to display net sales and commissions. The table uses the Anal font by default. The analyst will use a Text Format Expression to show commissions greater than $200 in Arial Bold font.

Which is the correct expression?

A.

=If(Conroission > 200, *')

B.

=If(Conroission > 200, 'Bold1)

C.

=If(Conroission > 200, 'Arial Bold')

D.

=If (Coitinission > 200, * Commissior.' )

Question # 3

Refer to the exhibits.

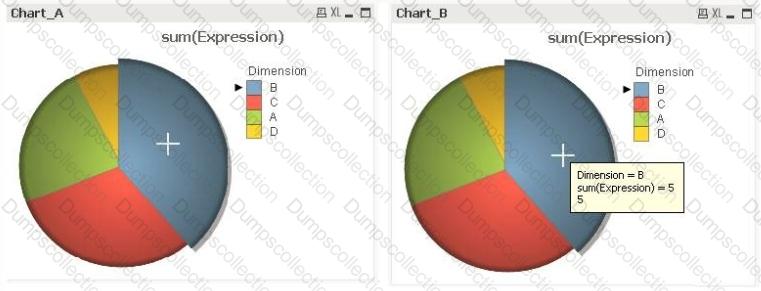
A business analyst needs to modify Chart_A so that it looks like Chart_B when users hover a mouse over it.

Which two actions should the business analyst take to meet this requirement? (Select two.)

A.

In the Dimensions tab, check Show All Values

B.

In the Expressions tab, check Text as Pop-up

C.

In the Presentation tab, check Pop-up Labels

D.

In the Expressions tab, check Values on Data Points

E.

In the Presentation tab, check Show Numbers in Legend

Question # 4

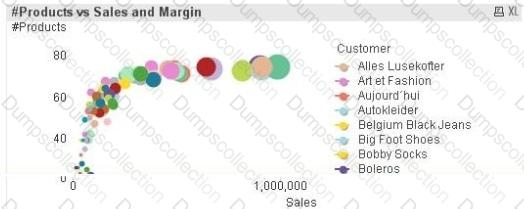
A business analyst needs to visualize the sales of products by product category, product sub-category, and product name. The analyst would like to see the relative sales by product hierarchy without using a drill-down dimension.

Which chart type should the analyst use?

A.

Grid chart

B.

Block chart

C.

Combo chart

D.

Radar chart

Question # 5

A business analyst wants to display sales by country region, city and customers. All the dimensions needs to be shown. Which chart can display a hierarchy without a drill-down dimension?

A.

Pivot table with allow pivoting

B.

Line chart with style option fill

C.

Straight table with dimension limit

D.

Radar chart with style option stacked

Question # 6

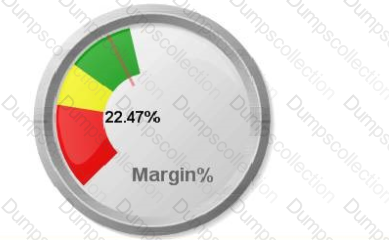
Which two objects are created with ONLY measures? (Select two.)

A)

B)

C)

D)

E)

A.

Exhibit A

B.

Exhibit B

C.

Exhibit C

D.

Exhibit D

E.

Exhibit E

Question # 7

A business analyst will compare sales growth between this year and last year by country. The analyst is given the sales values and must calculate the growth.

Which two charts can be used? (Select two.)

A.

Table box with country as dimension and sales per year as expression

B.

Bar chart with country and year as dimensions and sales as expression

C.

Gauge chart with country as dimension and sales per year as expression

D.

Pivot table with country and year as dimensions and sales as expression

E.

Funnel chart with country and year as dimensions and sales as expression

Question # 8

Refer to the exhibit.

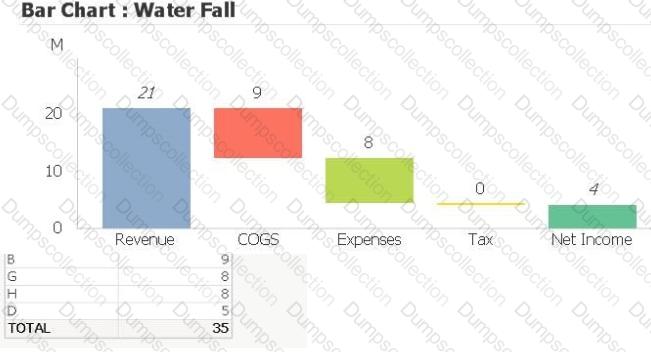
A business analyst creates a water fall chart to understand how an initial value is affected by a series of intermediate positive and negative values.

Which two actions must a business analyst perform to create the water fall chart shown? (Select two )

A.

Add five dimensions *

B.

Add five measures

C.

Check "Show as water fall" on the Style tab of the bar chart properties

D.

On the dimension limit properties sheet set limit to only show the first five values .

E.

Use the Bar Offset property with the correct expression

Question # 9

A data model contains 1 billion records and a straight table renders all of the data at the most granular level. The business users do NOT need all of the detailed information. The business analyst needs to improve the rendering time of the straight table.

Which two approaches should the analyst use? (Select two )

A.

Update the straight table to a more summarized view

B.

Replace all table fields with only one field which concatenates the values of all previous table fields

C.

Remove all master dimensions and master measures, and replace with distinct expressions in each visualization

D.

Specify a specific sort order in the output of the straight table using a field not found in the straight table columns

E.

Set up a calculation condition to only show the straight table if filtered down to a much smaller number of rows (e.g., 100k rows)

Question # 10

A business analyst needs to open another GlikView document by trigger Which two options can be used to perform this task? (Select two.)

A.

Text box trigger

B.

Field event trigger

C.

Line object trigger

D.

Activate sheet trigger

E.

Variable event trigger

Page: 1 / 2
Total 15 questions

Payment


Contact us

dumpscollection live chat

Site Secure

mcafee secure

TESTED 16 Oct 2025