Suppose training data are oversampled in the event group to make the number of events and non-events roughly equal. A logistic regression is run and the probabilities are output to a data set NEW and given the variable name PE. A decision rule considered is, "Classify data as an event if probability is greater than 0.5." Also the data set NEW contains a variable TG that indicates whether there is an event (1=Event, 0= No event).
The following SAS program was used.
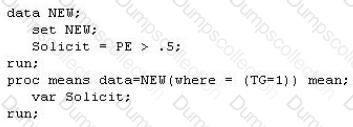
What does this program calculate?
An analyst generates a model using the LOGISTIC procedure. They are now interested in getting the sensitivity and specificity statistics on a validation data set for a variety of cutoff values.
Which statement and option combination will generate these statistics?
PROC GLMSELECT was used for building a model predicting the natural log of a baseball player's salary from certain performance and longevity statistics. The model used backward elimination using SBC as its selection criterion. The sequence of steps is summarized in the graphic shown below:
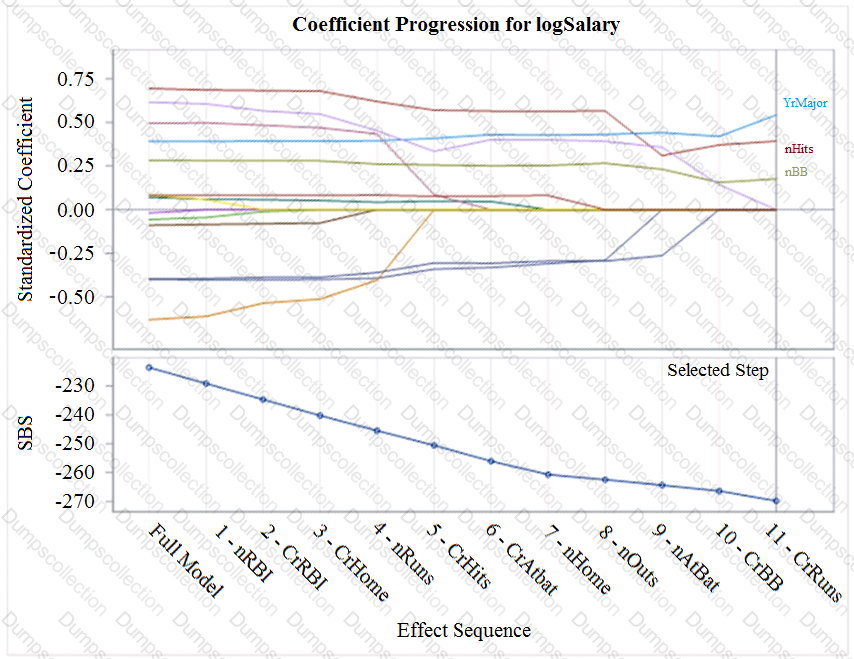
At Step 9 number of at bats (nAtBat) was removed from the model.
Why was it removed?
This question will ask you to provide a missing option. Given the following SAS program:
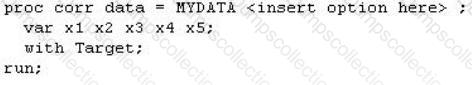
What option must be added to the program to obtain a data set containing Pearson statistics?
An analyst has a sufficient volume of data to perform a 3-way partition of the data into training, validation, and test sets to perform honest assessment during the model building process.
What is the purpose of the training data set?
Refer to the REG procedure output:
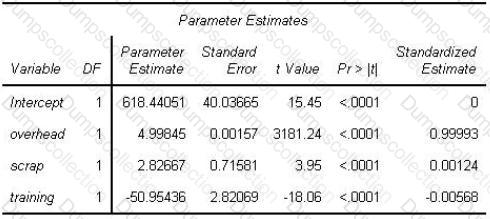
The Intercept estimate is interpreted as:
When mean imputation is performed on data after the data is partitioned for honest assessment, what is the most appropriate method for handling the mean imputation?
Refer to the exhibit:
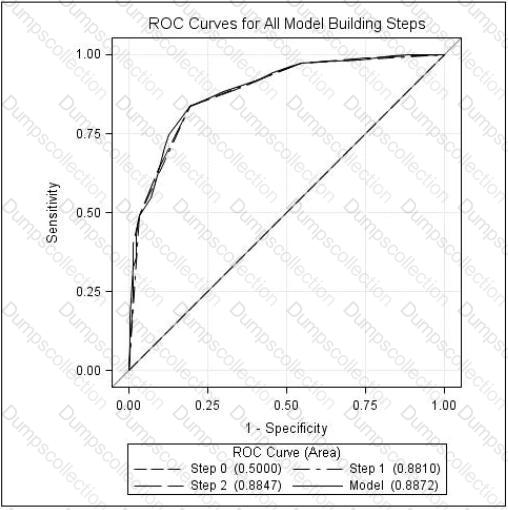
An analyst examined logistic regression models for predicting whether a customer would make a purchase. The ROC curve displayed summarizes the models. Using the selected model and the analyst's decision rule, 25% of the customers who did not make a purchase are incorrectly classified as purchasers.
What can be concluded from the graph?
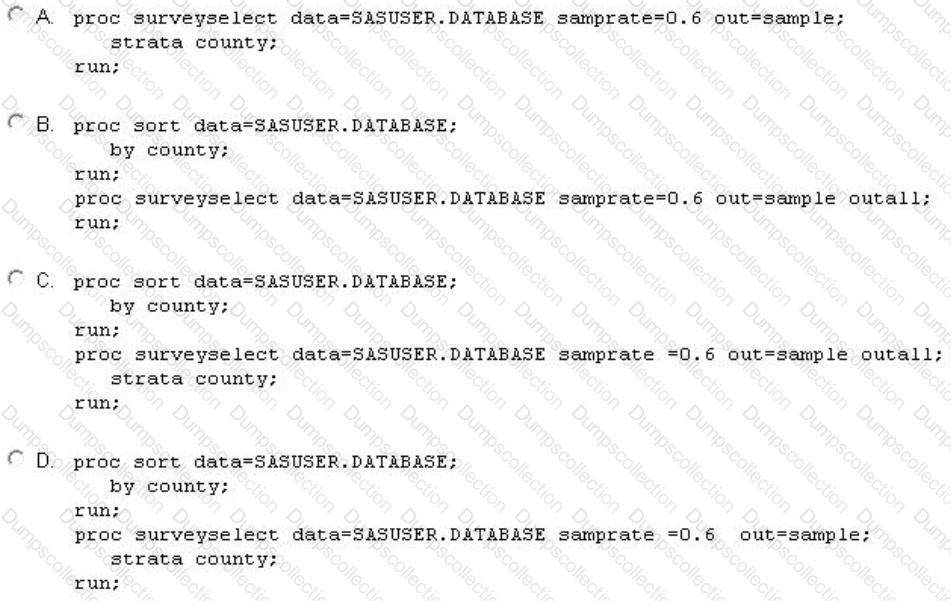
Which SAS program will divide the original data set into 60% training and 40% validation data sets, stratified by county?
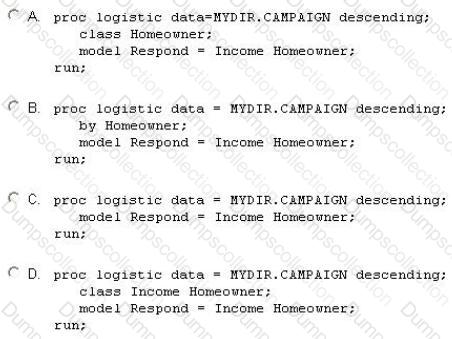
A marketing manager attempts to determine those customers most likely to purchase additional products as the result of a nation-wide marketing campaign.
The manager possesses a historical dataset (CAMPAIGN) of a similar campaign from last year.
It has the following characteristics:
Target variable Respond (0, 1)
Continuous predictor Income
Categorical predictor Homeowner(Y, N)
Which SAS program performs this analysis?

TESTED 19 Jul 2026