A Data Analyst has a website that displays data in a table format.
The analyst wants to connect to the data of the website by using the least amount of effort.
What should the analyst use to connect to the data?
You have the following visualization.
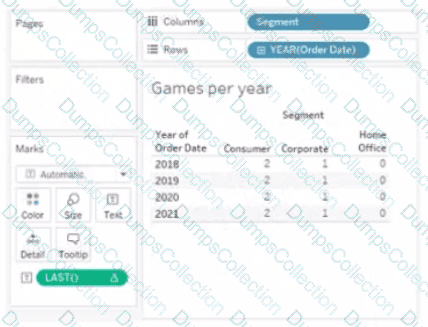
The Last() calculation is set to compute using Table (across)
Which value will appear in the crosstab for the Consumer segment of the year 2018 if you change compute to use Oder Dale?
How should a Data Analyst sort data by Sales across multiple dimensions in Tableau?
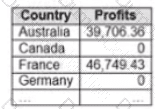
You have the following dataset that contain null values in the Profits field.
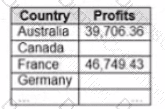
You want the data to appear as shown in the following table.
Which two formulas achieve the goal? Choose two.
Below are some of the values in the Order_ID field:
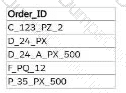
Which calculation should a Data Analyst use to return the two-letter combinations starting with the letter " P " for each of these values?
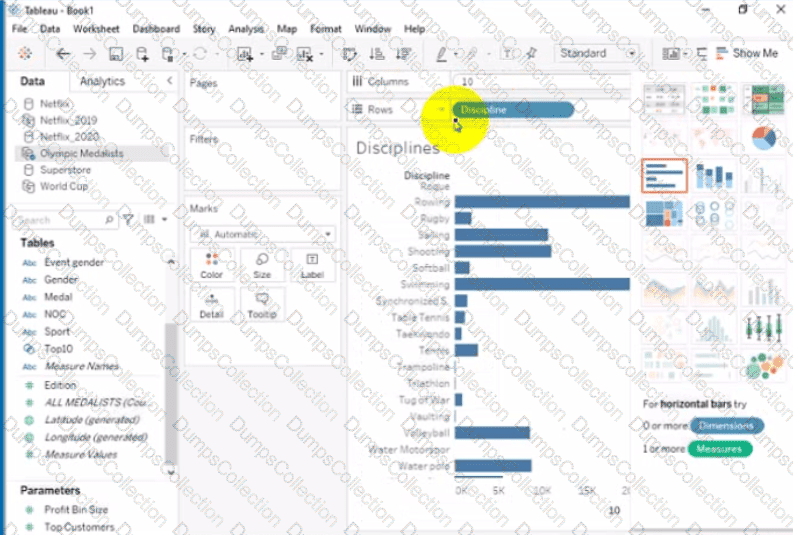
Open the link to Book1 found on the desktop. Open Disciplines worksheet.
Filter the table to show the members of the Top10 set and the members of the Bottom10 set. There should be a total of 20 rows.
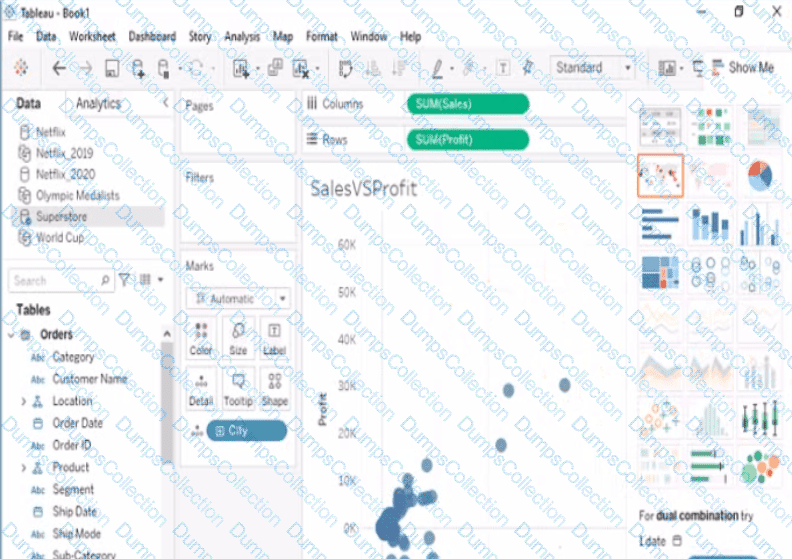
Open the link to Book1 found on the desktop. Open SalesVSProfit worksheet.
Add a distribution band on Profit to show the standard deviation from- 1 to 1.
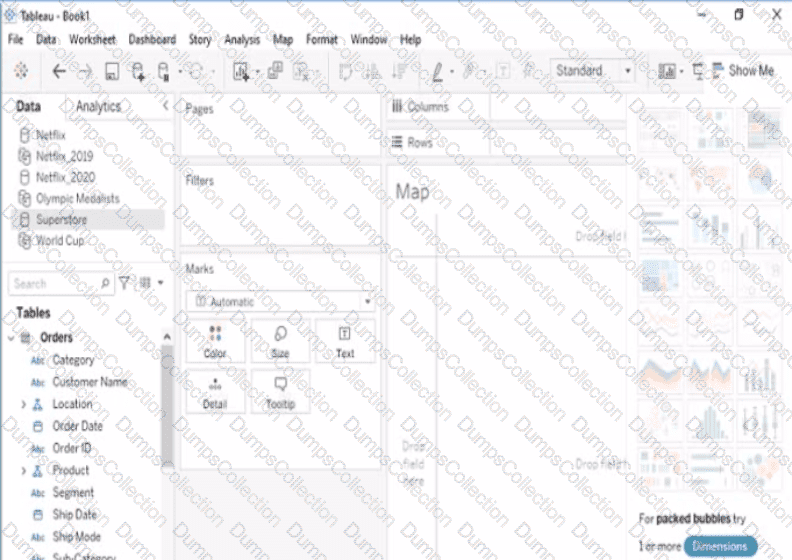
Open the Link to Book1 found on the desktop. Open Map worksheet and use Superstore data source.
Create a filed map to show the distribution of total Sales by State across the United States.
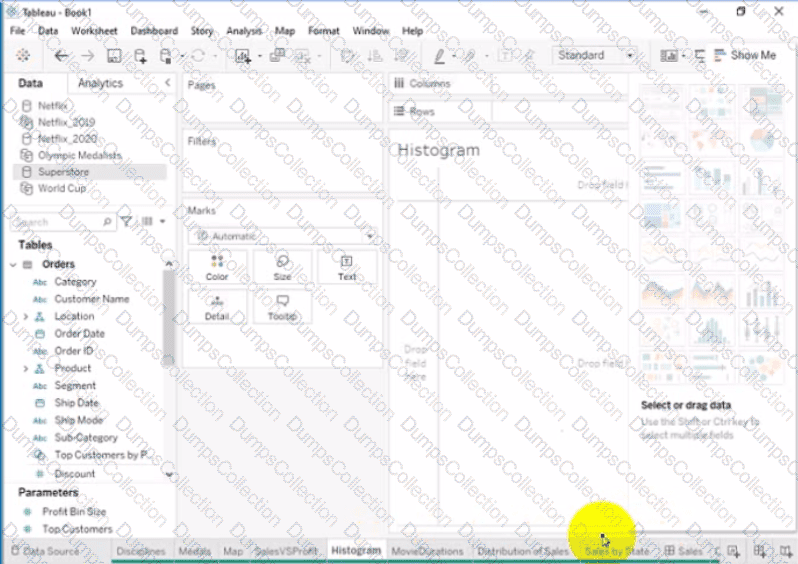
Open the link to Book1 found on the desktop. Open the Histogram worksheet and use the Superstone data source.
Create a histogram on the Quantity field by using bin size of 3.
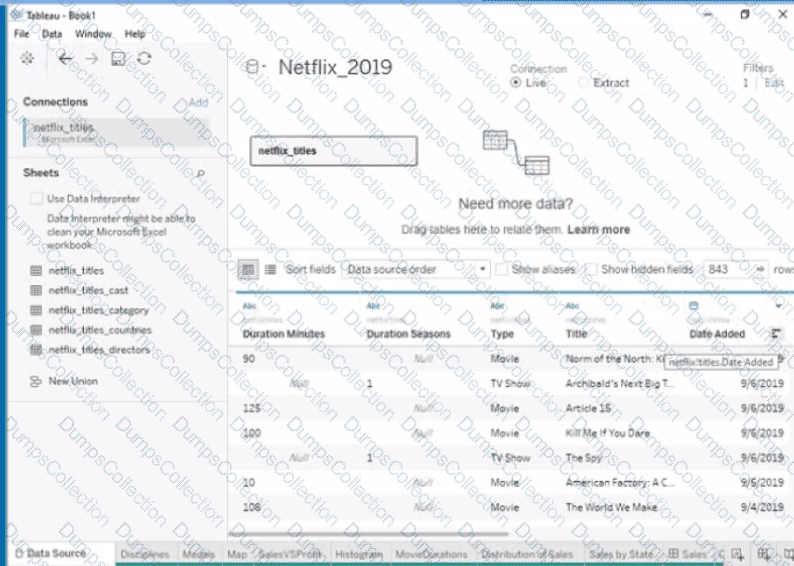
Open the link to Book1 found on the desktop. Open the Movie Durations worksheet.
Replace the existing data source with the Netflix_2019 data source.

TESTED 14 Jul 2026