True or False: All rows from both tables are returned in an INNER JOIN
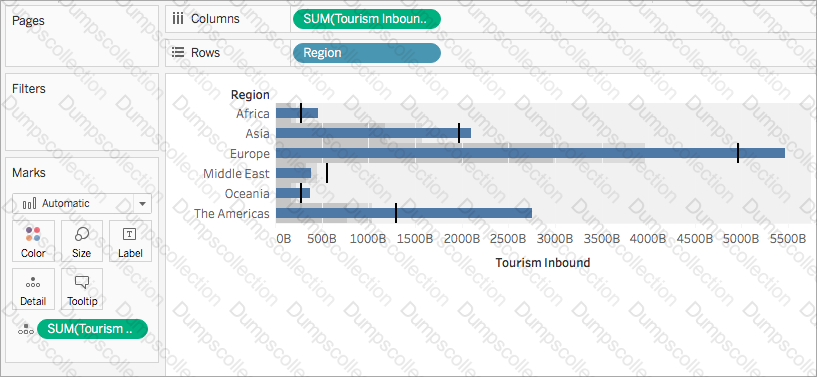
To display data that has both negative and positive quantitative values, Tableau Desktop will display marks by using__________________as the default.
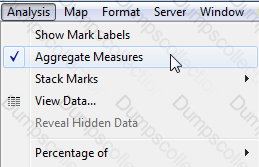
True or False: We can disaggregate the data, to see all of the marks in the view at the most detailed level of granularity
Which of the following is a good reason for using a bullet graph?
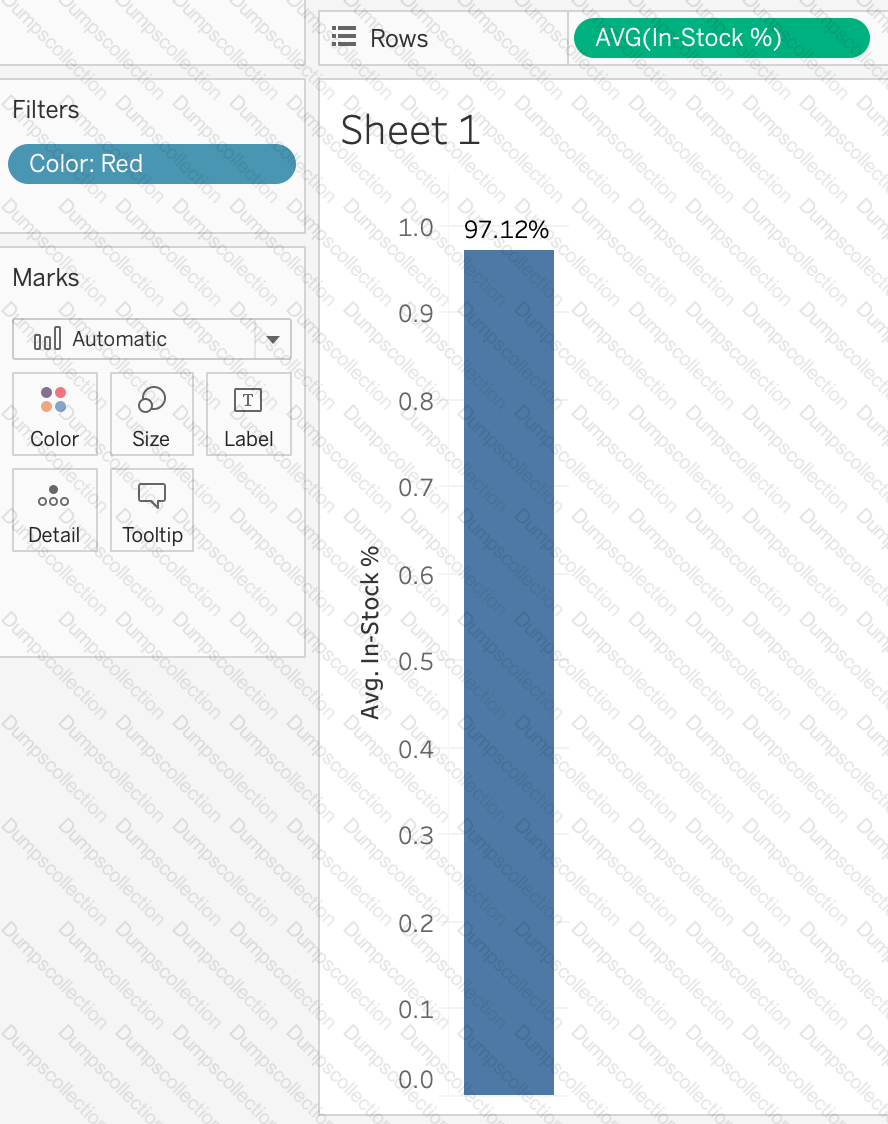
Using the Geo Data table, create a Bar chart showing the In-Stock percentage for each Color. What is the Average In-Stock percentage for the Color Red? Present your answer correctly upto 2 decimal places.
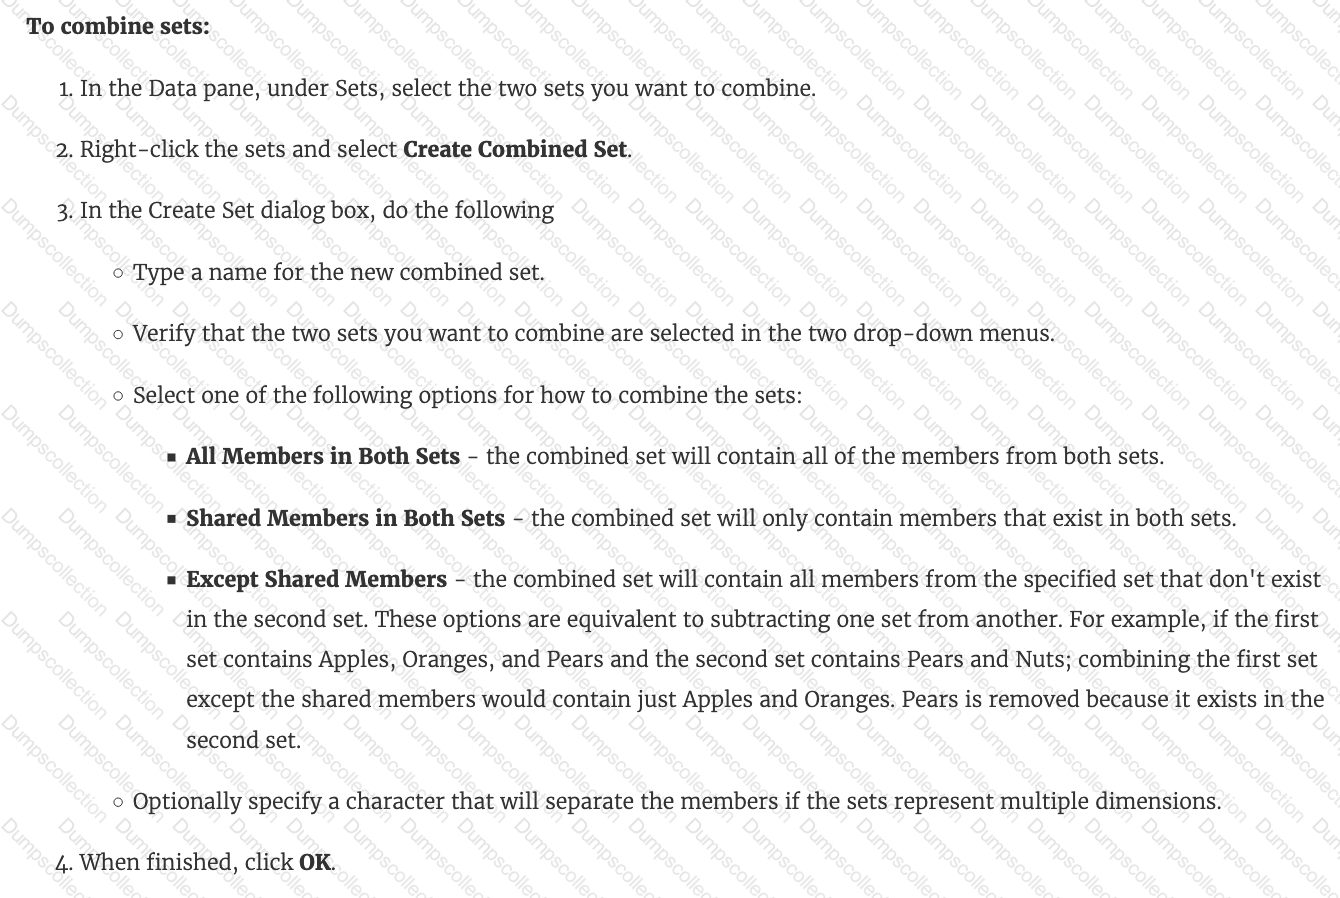
Which of the following sets would you use to compare the members?
_____________ contains the visualisations, info needed to build the visualisations, and a copy of the data source.
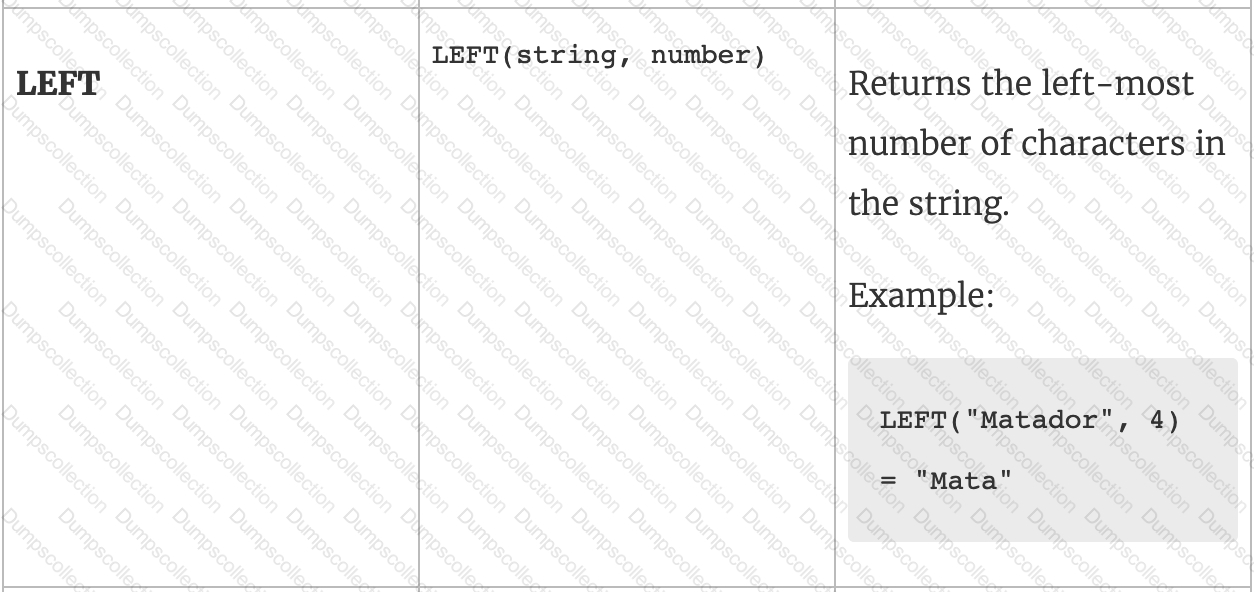
What will the following function return?
LEFT("Tableau", 3)
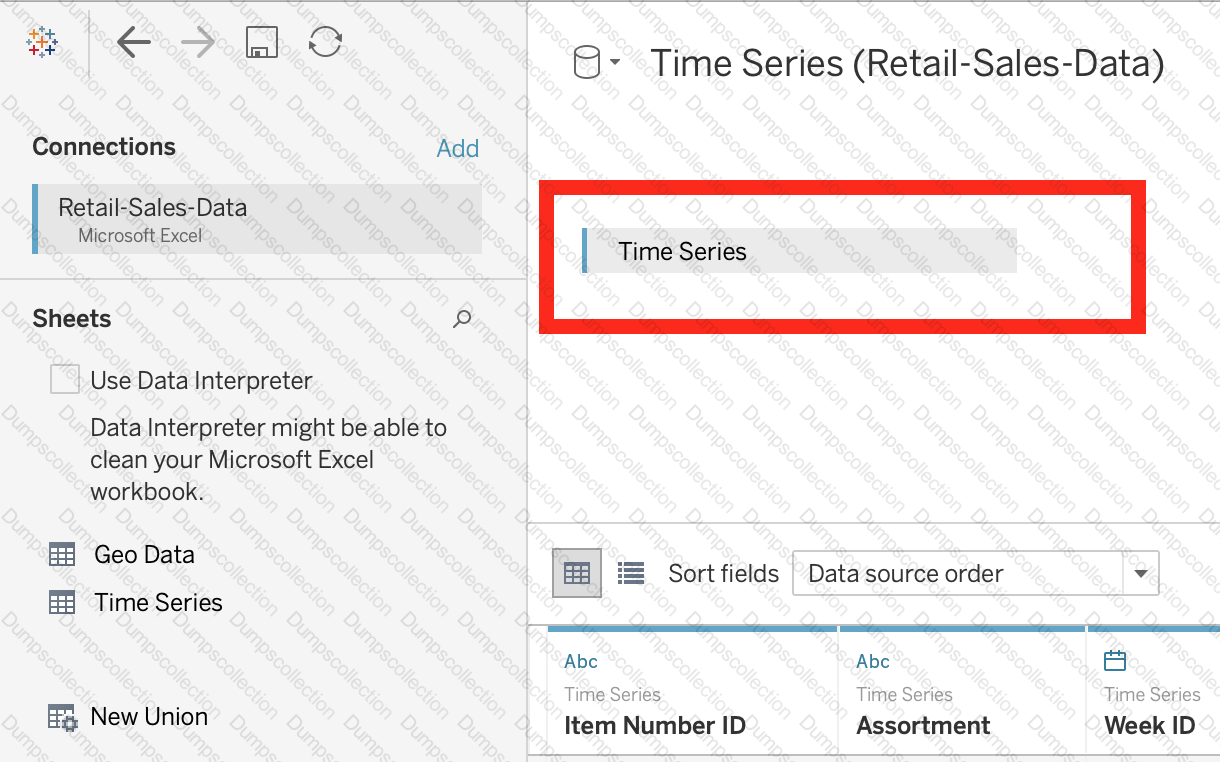
Download the Dataset from: https://drive.google.com/file/d/12AYHfiPWkwBmvH0zbumOURgUX6Az00Rw/view?usp=sharing
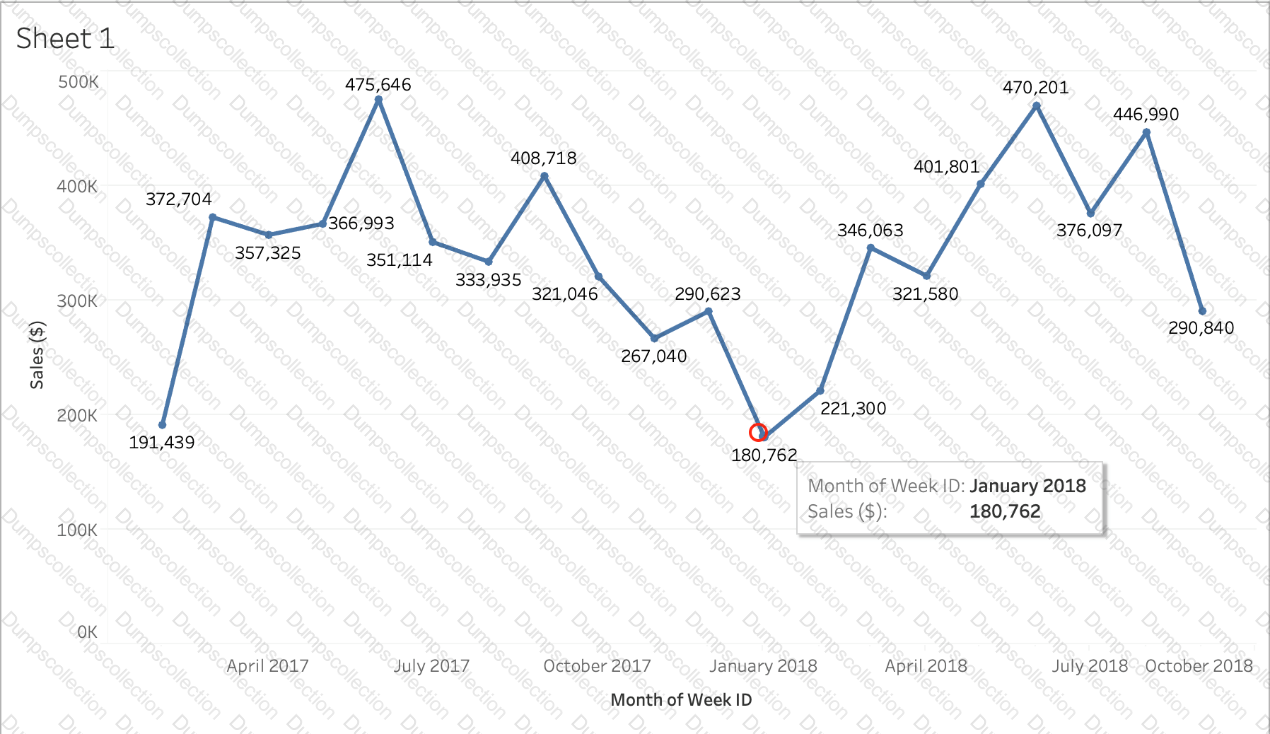
Using the Time Series Table, create a line chart to show Sales over time. Which Month and Year witnessed the lowest Sales?
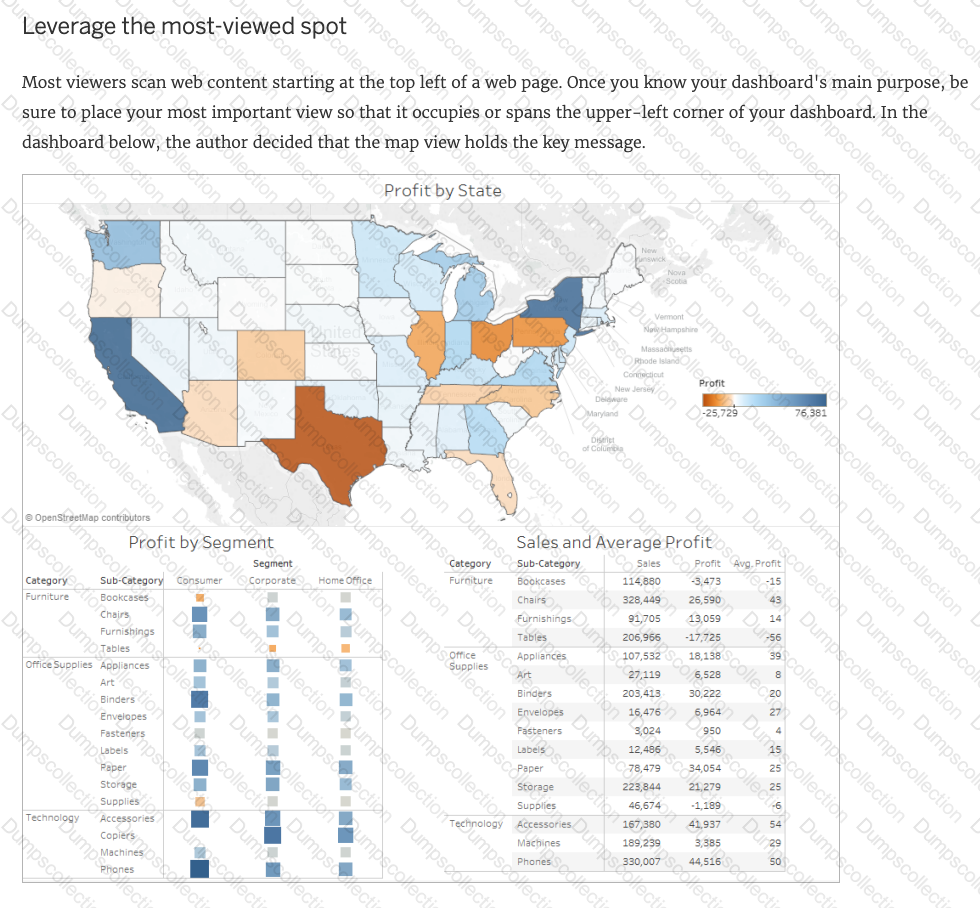
Most viewers scan content starting at the _____________ of a page.

TESTED 19 Jul 2026
 Text, letter
Description automatically generated
Text, letter
Description automatically generated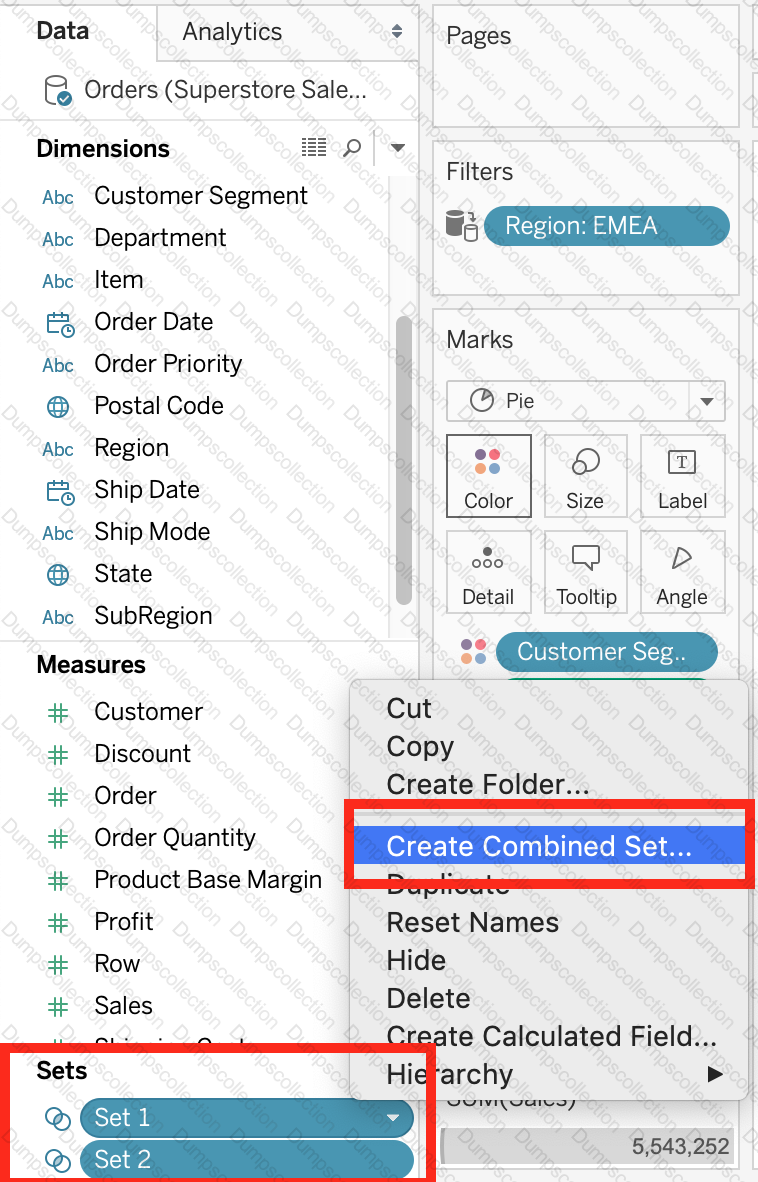 Graphical user interface, text, application
Description automatically generated
Graphical user interface, text, application
Description automatically generated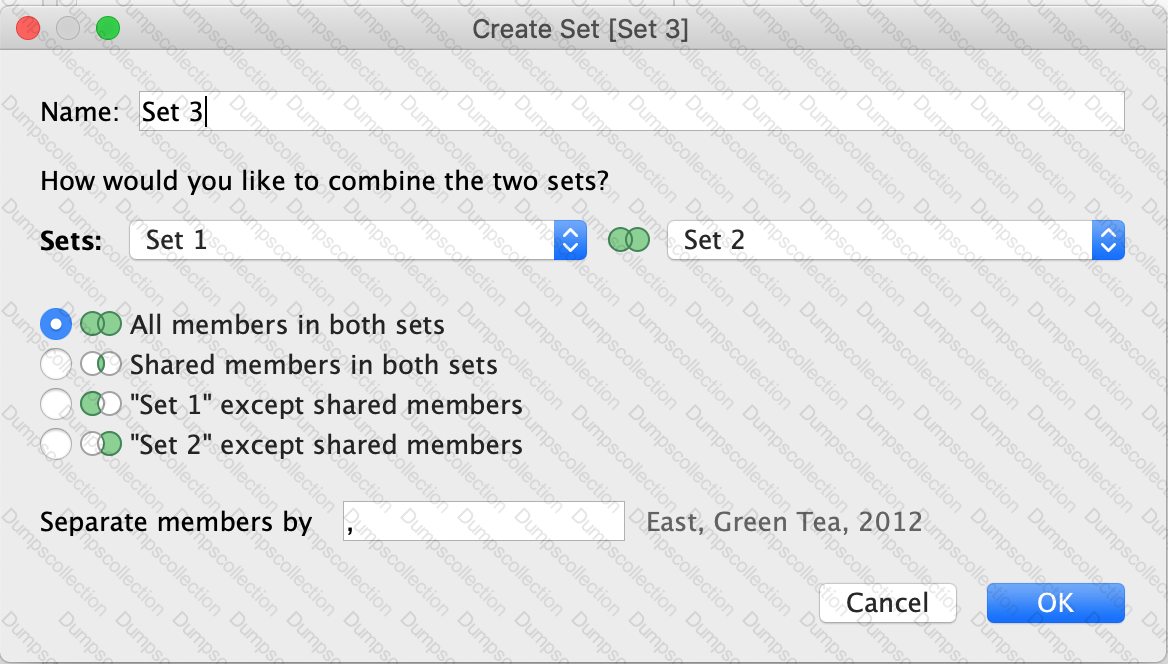 Graphical user interface, text, application, email
Description automatically generated
Graphical user interface, text, application, email
Description automatically generated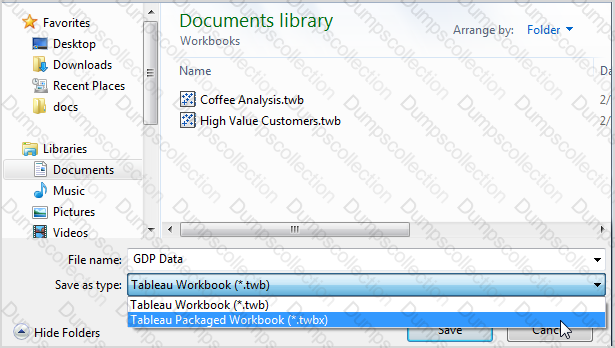
 A picture containing application
Description automatically generated
A picture containing application
Description automatically generated