A client currently has a workbook with the table shown below.
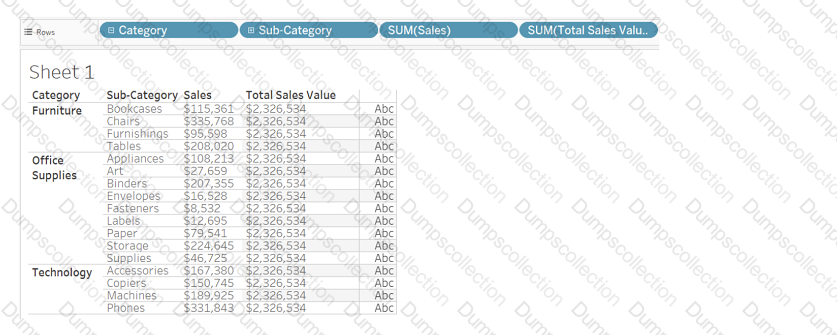
Which method will produce the output for the Total Sales Value field for all the categories shown in the table?
A client is working in Tableau Prep and has a field named Orderld that is compiled by country, year, and an order number as shown in the following table.
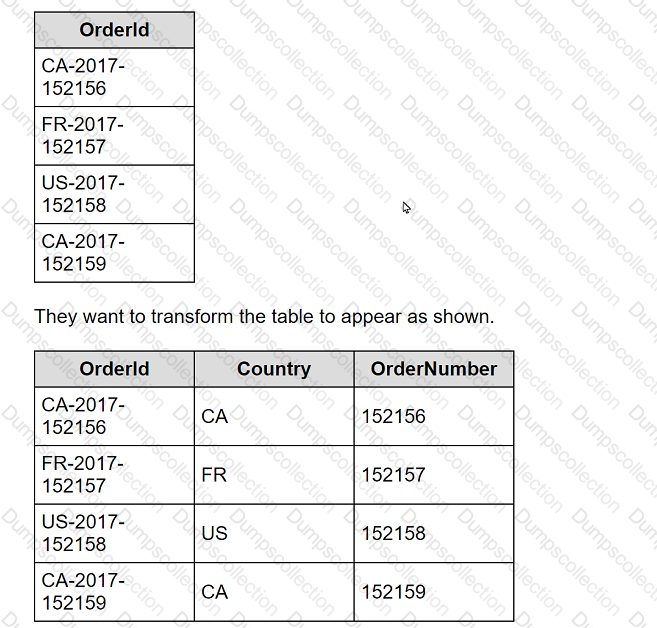
What should the consultant use to transform the table in the most efficient manner?
A client is searching for ways to curate and document data in order to obtain data lineage. The client has a data source connected to a data lake.
Which tool should the consultant recommend to meet the client's requirements?
A client wants to see data for only the last day in a dataset and the last day is always yesterday. The date is represented with the field Ship Date.
The client is not concerned about the daily refresh results. The volume of data is so large that performance is their priority. In the future, the client will be able
to move the calculation to the underlying database, but not at this time.
The solution should offer the best performance.
Which approach should the consultant use to produce the desired results?
A multi-national company wants to have a Tableau dashboard that will provide country-level information for both its forecast summaries and year-on-year
metrics. The company wants to toggle between these two views while leaving main key performance indicators (KPIs) visible on the main dashboard.
Which method is the most efficient in achieving the company's requirements?
A client wants to flag orders that have sales higher than the regional average.
Which calculated field will produce the required result?
Use the following login credentials to sign in
to the virtual machine:
Username: Admin
Password:
The following information is for technical
support purposes only:
Lab Instance: 40201223
To access Tableau Help, you can open the
Help.pdf file on the desktop.
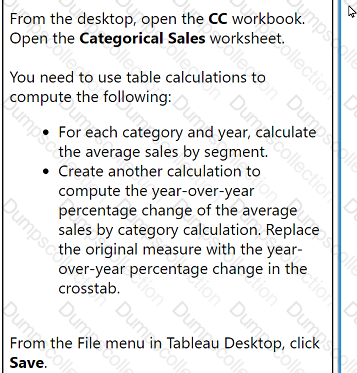
From the desktop, open the CC workbook.
Open the Categorical Sales worksheet.
You need to use table calculations to
compute the following:
. For each category and year, calculate
the average sales by segment.
. Create another calculation to
compute the year-over-year
percentage change of the average
sales by category calculation. Replace
the original measure with the year-
over-year percentage change in the
crosstab.
From the File menu in Tableau Desktop, click
Save.
From the desktop, open the CC workbook.
Open the Manufacturers worksheet.
The Manufacturers worksheet is used to
analyze the quantity of items contributed by
each manufacturer.
You need to modify the Percent
Contribution calculated field to use a Level
of Detail (LOD) expression that calculates
the percentage contribution of each
manufacturer to the total quantity.
Enter the percentage for Newell to the
nearest hundredth of a percent into the
Newell % Contribution parameter.
From the File menu in Tableau Desktop, click
Save.
From the desktop, open the CC workbook.
Open the Incremental worksheet.
You need to add a line to the chart that
shows the cumulative percentage of sales
contributed by each product to the
incremental sales.
From the File menu in Tableau Desktop, click
Save.
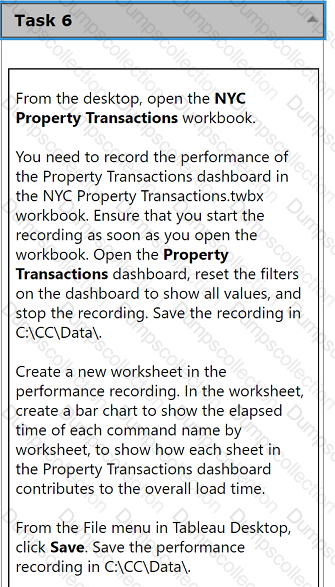
From the desktop, open the NYC
Property Transactions workbook.
You need to record the performance of
the Property Transactions dashboard in
the NYC Property Transactions.twbx
workbook. Ensure that you start the
recording as soon as you open the
workbook. Open the Property
Transactions dashboard, reset the filters
on the dashboard to show all values, and
stop the recording. Save the recording in
C:\CC\Data\.
Create a new worksheet in the
performance recording. In the worksheet,
create a bar chart to show the elapsed
time of each command name by
worksheet, to show how each sheet in
the Property Transactions dashboard
contributes to the overall load time.
From the File menu in Tableau Desktop,
click Save. Save the performance
recording in C:\CC\Data\.

TESTED 19 Jul 2026